Traumatic Brain Injury
Traumatic brain injury (TBI) covers a wide range of injuries to the brain. Data on TBI is collected from many sources such as hospitals, sporting events, the military, and surveys sent out to individuals that have sustained a head injury. Choose a dataset below that interests you to begin exploring the data behind TBI.
NCAA Injury Surveillance System
The NCAA Injury Surveillance System (ISS) was first developed in 1982 to provide current and detailed injury statistics for college-level athletics. Currently data is collected yearly via an online system where trainers and coaches can submit information about their player's injuries. The information collected by the ISS is used by the both colleges and the NCAA when making decisions and creating new policies for a particular sport. The system is free and periodically the NCAA publishes a summary of their data for 15 men's and women's sports. The data included here is from the most recent summary report in 2004.
NCAA Web link: http://www.ncaa.org/wps/portal/ncaahome?WCM_GLOBAL_CONTEXT=/ncaa/NCAA/ Academics+and+Athletes/Personal+Welfare/Iss/index.html
The NCAA ISS data is divided into three subsets, each exploring a different aspect of sports injury:
Data Subsets:
-
Games and Practices With Associated Injury Rates
This subset of data shows the total number of games and practices, and injury rates reported for a particular sport since data collection was started. Injuries rates are divided out by the time during the season (preseasons, in season, and post season) and whether the injury occurred during a game or a practice. Use the table below to preview the kind of information presented in this dataset:Variable Explanation Total Number of Games Reported This is the overall number of games played across all teams reporting injury information to the NCAA ISS since data collection was started for the sport. Game Injury Rate per 1000 Athlete Exposures The rate of injuries sustained out of 1000 exposures to a possible injury during a game. Total Number of Practices Reported This is the overall number of practices played across all teams reporting injury information to the NCAA ISS since data collection was started for the sport. Practice Injury Rate per 1000 Athlete Exposures The rate of injuries sustained out of 1000 exposures to a possible injury during a practice. -
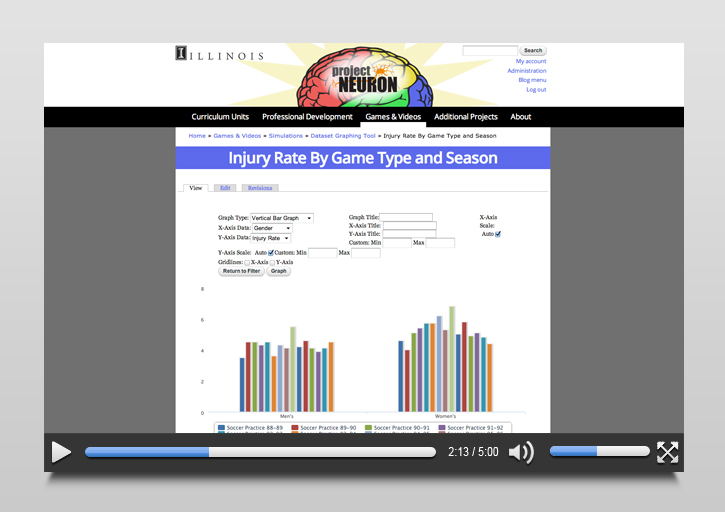
Injury Rate By Game Type and Season
This subset of data shows the total injury rate for a particular sport's competitive games and practices for each season data was collected by the NCAA ISS. Use the table below to preview the kind of information presented in this dataset:Variable Explanation Injury Rate per 1000 Athlete Exposures The rate of injuries sustained out of 1000 exposures to a possible injury. -
Body Regions Injured Most Often by Game Type
Data in this subset consist of the body regions most commonly injured during a competitive game or practice since data collection was started for a particular sport. Body regions that accounted for more than 1% of total injuries have been included and have also been condensed so that there are 14 major body regions. Use the table below to preview the kind of information presented in this dataset:Variable Explanation Frequency The total number of injuries to a particular body region since the start of data collection. % of Injuries The percent of all injuries reported accounted for by a particular body region. Injury Rate per 1000 Athlete Exposures The rate of injuries sustained to a particular body region out of 1000 exposures to a possible injury.
What is "data"? Data can be a set of facts, measurements, numbers, words, or any other piece of information that can be collected, categorized, or described. Data collection plays a critical role in the work of scientists and researchers, but once you have the data, what do you do with it? How does a long list of data points become an answer to a question or the solution to a problem? The Dataset Graphing Tool is designed to explore some selected datasets and generate graphs to present data in a meaningful way.
This short instructional video demonstrates how to use the Dataset Graphing Tool. Watch the video and explore the data!


